

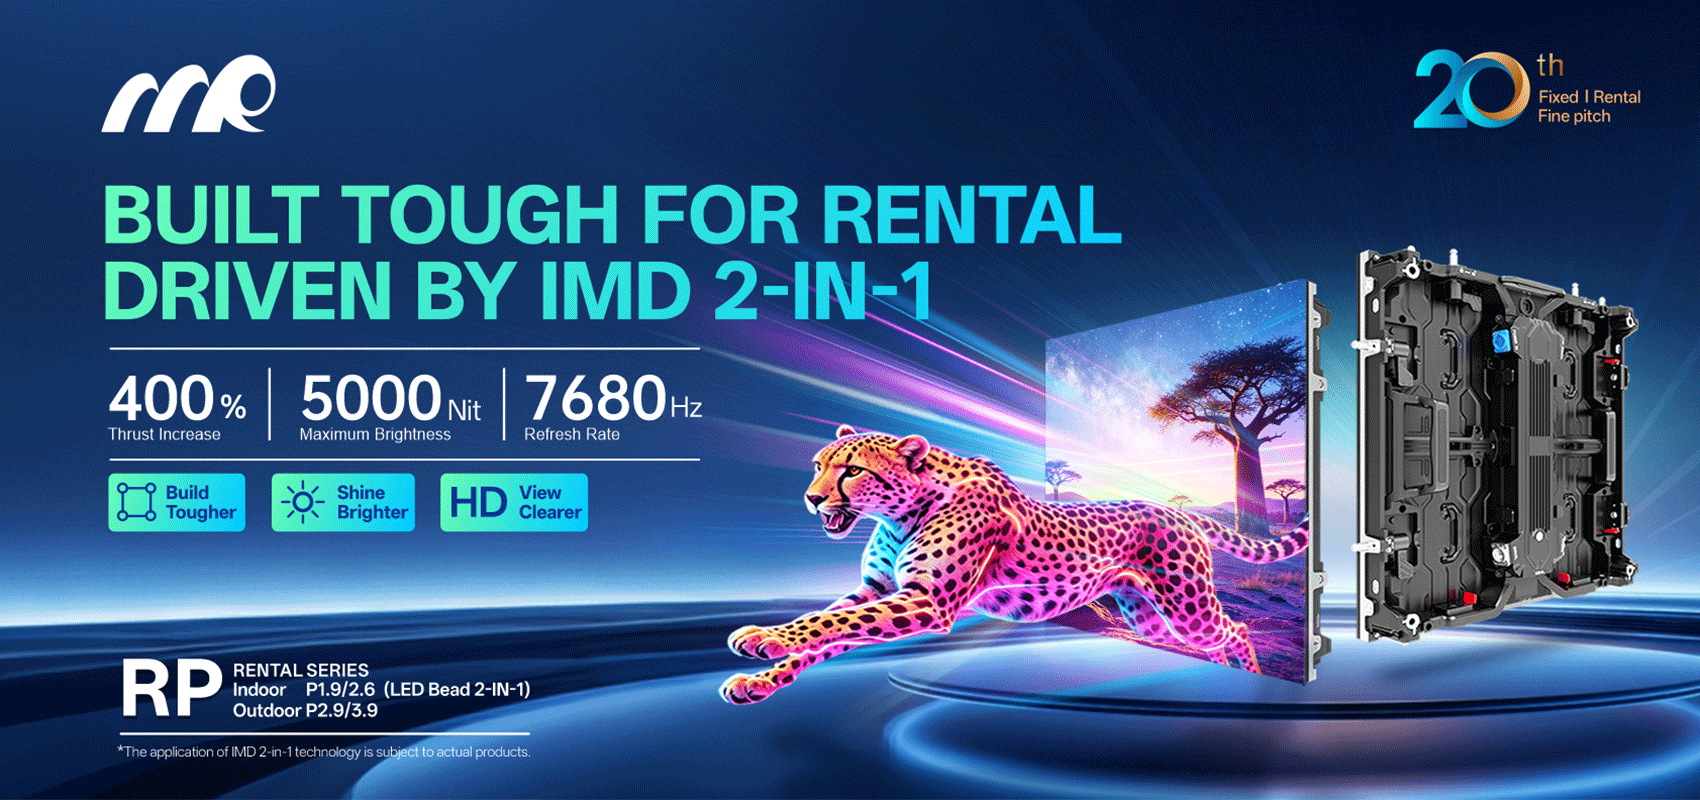
Why pixel pitch dominates procurement choices
Comparative Insight starts here: procurement teams measure value by visibility, durability, and lifecycle cost. A precise comparison of pixel pitch, cabinet construction, and service terms cuts vendor talk into actionable points. Early on, review sample footage on a trusted source such as a led display screen to align expectations for brightness, refresh rate, and overall image fidelity.
Defining the variables that impact performance
Keep definitions tight. Pixel pitch sets minimum viewing distance and perceived resolution. Brightness and contrast determine legibility in daylight. Cabinet modularity and ingress protection ratings determine installation speed and service risk. These are not marketing labels; they are procurement levers. Compare specifications side by side and score them numerically for a clear ranking.
Pixel pitch versus total cost — a direct comparison
Smaller pixel pitch improves crispness at close range but increases initial cost and weight. Larger pitch lowers cost but often demands greater viewing distance. Factor in installation, structural supports, and power consumption when calculating total cost of ownership. Use simple math: amortize capital expense over expected hours of use, then add maintenance cycles. This yields a true cost per viewing-hour, which speaks louder than sticker price.
Supplier traits that change ROI
Vendors differ in warranty terms, spare-part logistics, and calibration services. Those three areas often determine the real ROI more than panel price. A supplier offering local spares and on-site calibration reduces downtime and extends usable life. Assess service level agreements and mean time to repair; a one-week repair delay in a high-visibility site like Times Square destroys expected impressions and skews ROI calculations.
Common procurement mistakes and how to avoid them
Avoid specification shopping and siloed decision-making. Procurement that focuses on pixel pitch alone misses environmental factors: heat, humidity, and direct sunlight change performance. Also avoid one-off benchmarking — test panels under real ambient conditions. Bring installation teams into the evaluation loop — they will flag weight, mounting, and cabling constraints early. These steps prevent scope creep and hidden costs.
Quick comparative checklist for on-site evaluation
Use this checklist during demos: 1) Measured brightness (nits) under direct sunlight; 2) Measured refresh rate and scan method for motion clarity; 3) Ease of module replacement and spare-part availability. Score 1–5 on each. The numeric score accelerates vendor comparison and makes trade-offs transparent — procurement decisions become defensible rather than speculative.
Estimating ROI with practical metrics
Translate technical specs into business metrics. Estimate impressions per day based on location and expected dwell time. Combine impressions with campaign CPM to forecast revenue or brand-equity value. Subtract operating costs: power, scheduled maintenance, and expected spare modules. The result is a projected payback period. Shorter payback means lower financial risk — simple, measurable, and repeatable.
Advisory: three critical evaluation metrics
1) Effective Viewing Distance: match pixel pitch to the lowest expected viewer distance; this preserves message clarity. 2) Service Turnaround Time: insist on local inventory or guaranteed on-site repair windows — downtime erodes ROI. 3) Energy Efficiency and Heat Management: lower power draw and good thermal design cut operating cost and improve LED life. Use these three as deal-breakers during negotiation.
Final assessment and procurement posture
Procurement must balance technical rigour with commercial sense. Choose suppliers that provide verified field data, clear SLA terms, and practical site support — that combination yields predictable ROI. For reliable options and field-proven installations, consider suppliers who document performance in major urban sites; they make deployment simpler and outcomes measurable. MR LED. —